

Not for navigation. Breakpoint charts are for trip planning. Navigate with official charts and your vessel’s instruments.
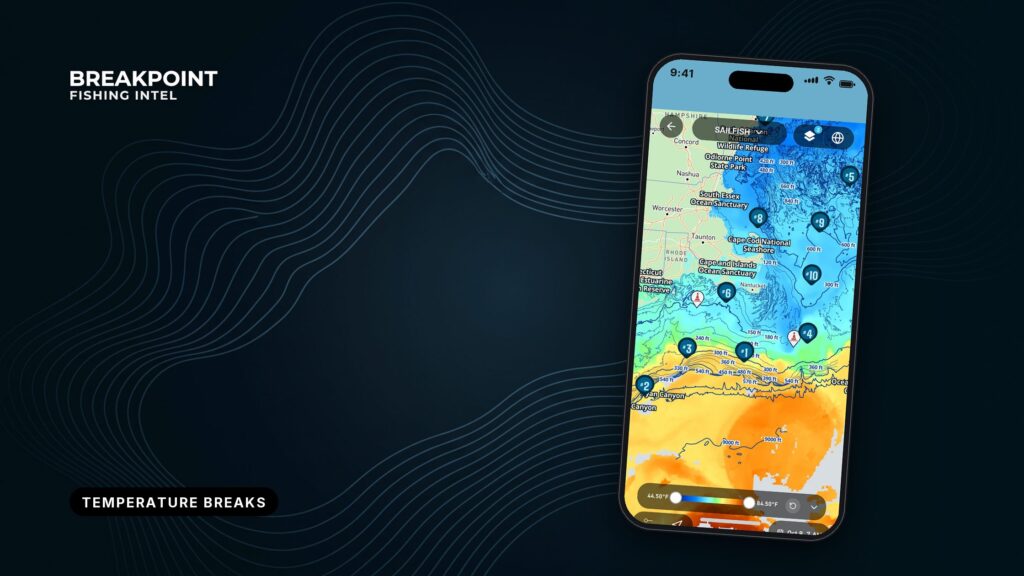
A temperature break is a place where sea-surface temperature changes quickly over a short distance. It marks the boundary between 2 water masses. On an SST map it shows as a tight band of color change. Bait collects along it, and pelagic gamefish hunt it.
The night before a trip you open the map and see a screen full of color, and you need to pick 1 place to run. Start with a sea-surface-temperature break. It is where the ocean sorts itself into water that holds fish and water that doesn’t.
Reading a break comes down to three habits: find the tight edge, know how old the picture is, and know what the satellite couldn’t see. The image is useful but limited, and this guide covers both so you can decide where to look with better information.
It covers what a break is, why fish hold on one, how the image is made, how to read one, where the image falls short, and how to stack layers before you choose a run.
What is a temperature break, and why do fish hold on one?
Start with the terms. Temperature is the reading at a point on the surface. A gradient is how fast that temperature changes across distance. A break, or thermal front, is a place where the gradient is steep. A water mass is a large body of water with its own temperature and character.
When 2 water masses meet, the boundary between them is the break. A big change over a short distance counts for more than the same change spread over many miles.
A break works as structure in open water, much as a reef does on the bottom. Pelagic fish have no ledge to relate to, so they use the edge. Here is what an edge does for them:
- 2 water masses meet and push against each other.
- Bait gets pinned along the edge.
- Upwelling on the cool side brings up nutrients.
- The warm side often works as the hunting lane for tuna, mahi, wahoo and billfish.
Which side holds fish depends on the target species. Set the scale to your target species’ range and read the edge from there.
The Gulf Stream edge off Fort Lauderdale is a familiar example. It sits close to the beach, and warm Gulf Stream water presses against shelf water along a current edge you can see on the map.
How is satellite SST imagery made?
The satellite reads heat coming off the top of the water, and what it can’t see through shapes everything you read on the map.
Infrared, microwave and the skin layer
Infrared sensors read the skin of the ocean, a layer about 10 to 20 micrometers deep, according to how satellites read skin temperature from the European Space Agency. Clouds block infrared. Microwave sensors read slightly deeper into the surface layer and see through cloud, but at coarser resolution.
Blending microwave with infrared gives greater coverage, as described for blended microwave and infrared SST products. Much infrared SST comes from instruments such as MODIS, VIIRS and AVHRR.
The map shows the skin, and fish swim below it.
Passes, resolution and why clouds leave holes
A pass is one satellite overpass, and every pass carries a timestamp. Clouds leave holes because the sensor can’t read through them.
The NOAA CoastWatch geo-polar blended SST page lays out the sampling. Polar orbiters sample at about 1 km roughly every 6 hours. Geostationary satellites sample at about 5.5 km hourly. NOAA combines them into a daily blended product at 5 km.
| Platform | Spatial resolution | Revisit |
|---|---|---|
| Polar orbiter | About 1 km | About every 6 hours |
| Geostationary | About 5.5 km | Hourly |
| Daily blended product | 5 km | Daily |
Resolution matters for breaks, since a break narrower than a pixel can blur or disappear.
Satellite SST measures what it measures well. Median per-pixel uncertainty in a long satellite SST record uncertainty study is 0.18 K against drifting buoys. That is a good result for the skin, and it says nothing about the water below.
How to read a temperature break on an SST map
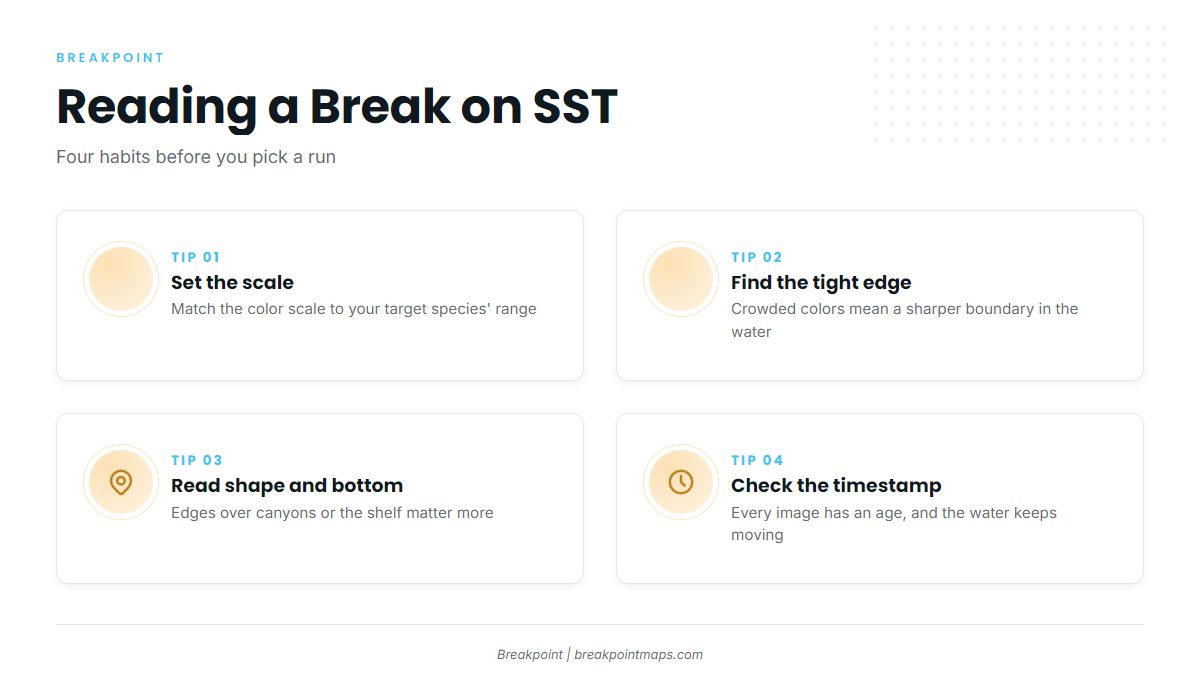
Look for where the colors crowd together, inside the range you care about and close enough to reach.
SST and chart layers are not for navigation. Use official charts.
Set the color scale to your species
A wide scale hides breaks, and a narrow scale exaggerates them. Set the scale to your target species’ range, then look for the tight bands inside it.
Read the tightness of the color change
A tighter color transition means a sharper boundary in the water.
Read the shape and what it sits over
Shape tells you what is driving the edge:
- A linear break suggests a current edge.
- A curved break suggests an eddy, either warm-core or cold-core.
- A tongue shape suggests a filament of water pushing in from elsewhere.
- Fingers pushing inshore are worth marking.
A break that lines up with a canyon or the shelf edge matters more than one over flat bottom. For more, see more on reading break shapes.
Check the pass timestamp
Every image has an age, and the water keeps moving after the pass. Check the time before you trust the edge.
Annotated example showing a tight edge, a finger and an eddy. SST layers are not for navigation.
Observed passes vs blended products: which should you trust?
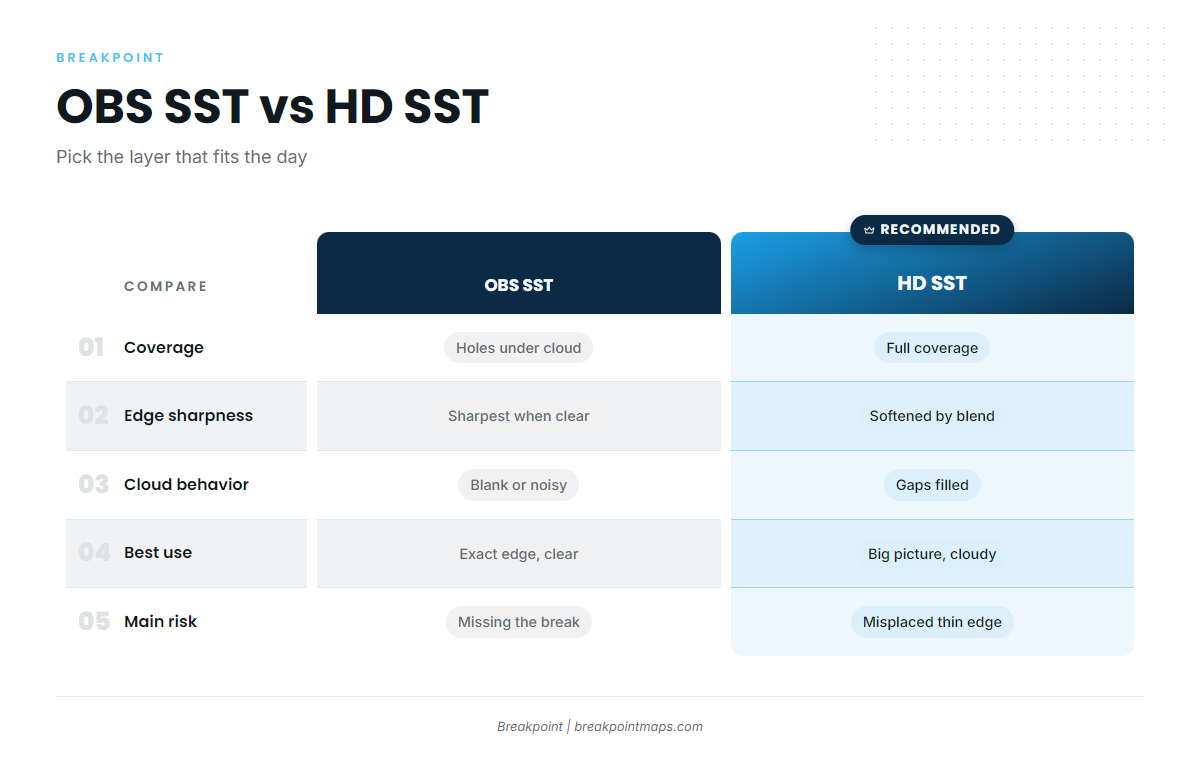
An observed pass shows what the satellite actually saw, with cloud gaps but sharp edges. A blend fills the gaps and smooths the edges.
Where cloud blocked the pass, there is no infrared reading. At cloud edges, thin cloud or fog can contaminate pixels and fake a cool patch.
A blend fills those holes with optimal interpolation, the method the NOAA blend uses. It estimates missing pixels from surrounding data and other sensors, which can soften a thin edge or shift it slightly.
| OBS SST (observed pass) | HD SST (blended) | |
|---|---|---|
| Coverage | Holes where cloud blocked the pass | Full coverage |
| Edge sharpness | Sharpest edges where clear | Edges softened by blending |
| Cloud behavior | Blank, or contaminated at cloud edges | Gaps filled by estimate |
| Best use | Confirming exact edge position on clear days | Big picture on cloudy days |
| Main risk | Missing the break under cloud | A smoothed or misplaced thin edge |
For the full layer choice, read OBS SST vs HD SST, and when to use each.
Open OBS SST and HD SST side by side for the same morning and compare the edge. Where both layers agree, confidence goes up.
What can’t a single pass tell you?
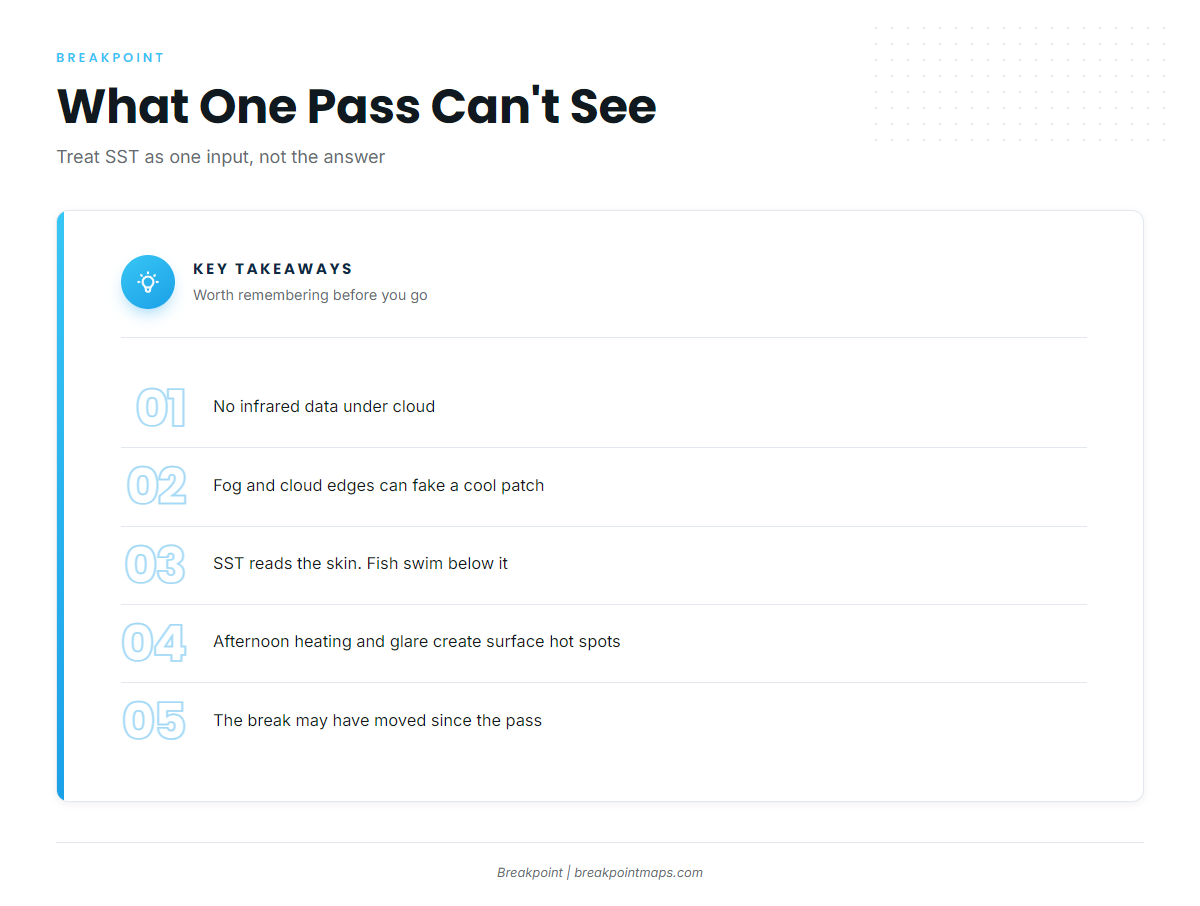
A single pass is a snapshot with known blind spots:
- Cloud gaps: No infrared data under cloud.
- Fog and cloud edges: These can contaminate pixels and fake a cool patch.
- Skin vs water below: The reading is microns deep. Fish are below it.
- Afternoon heating and glare: These create skin hot spots that don’t extend down.
- Image age: The break may have moved since the pass.
- Blend smoothing: This can soften or misplace an edge.
The industry also uses altimetry, or sea surface height, to see eddies under cloud. Treat SST as 1 input rather than the answer.
How do you combine a break with Chlorophyll and current data to choose where to run?
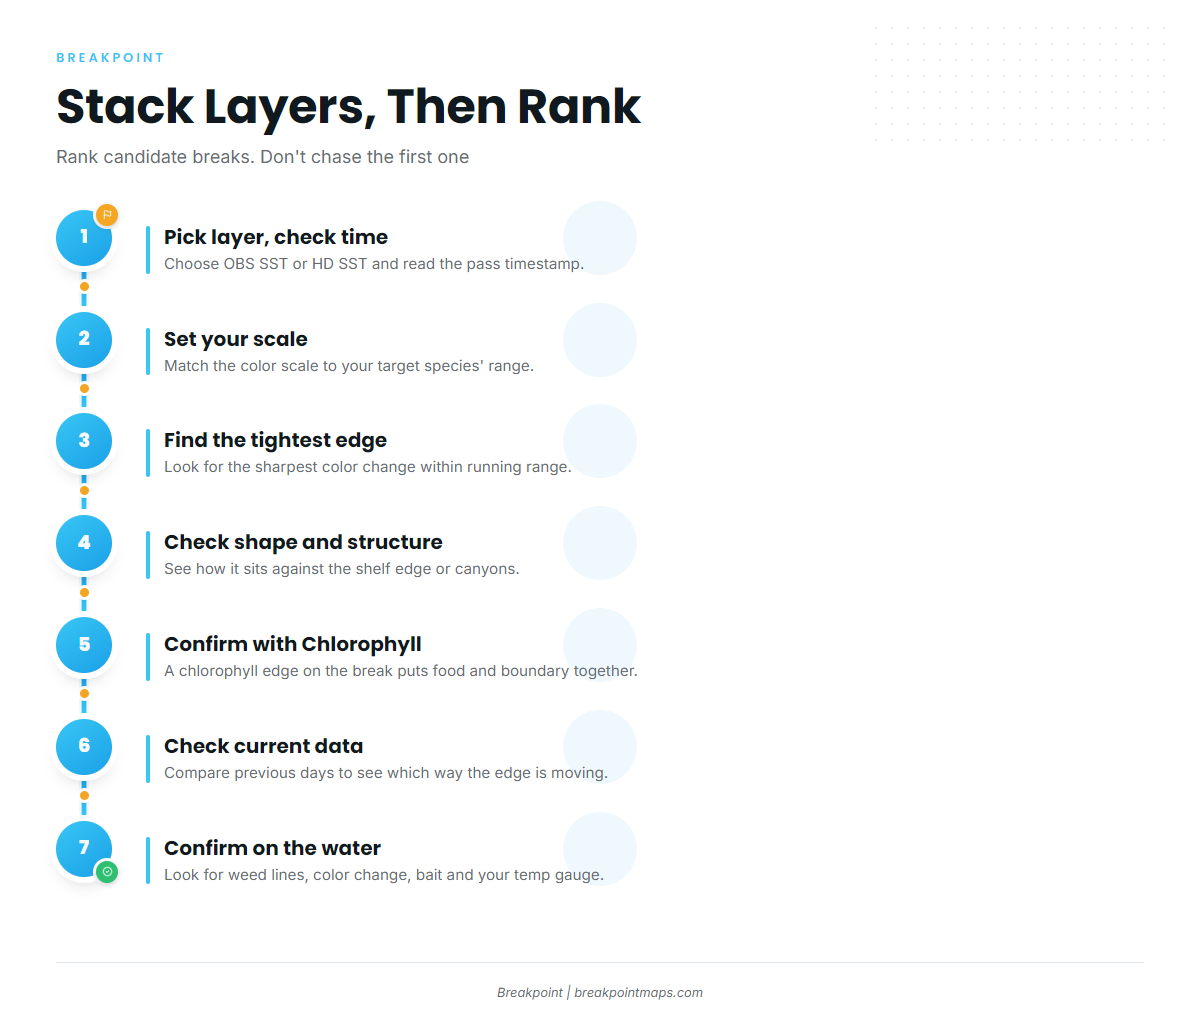
Rank candidate breaks instead of chasing the first one you find. Work through this checklist:
- Pick the layer and check the pass time. Know how old the picture is.
- Set the scale to your target species’ range. Let the edges inside it stand out.
- Find the tightest color change within running range. Distance counts.
- Check its shape and its relationship to the shelf or canyons. Structure adds weight.
- Confirm it with Chlorophyll. A chlorophyll edge lined up with the temperature break means the boundary and the food are in the same place.
- Check current data and the previous days. See which way the edge is moving. Then confirm on the water with weed lines, color change, bait and your own temperature gauge.
When 2 breaks look similar, take the one that is sharper, sits on structure, and has Chlorophyll agreeing.
In practice, warm Gulf Stream water presses against greener shelf water. Read the same edge on 2 mornings to see which way it moved, then set your starting point where the edge is likely to sit today.
If you mark the edge as a waypoint for your chartplotter, remember that SST and chart layers are not for navigation. Use official charts.
Before you commit to the run, check the NWS Miami coastal waters forecast for wind, wave height and period. That zone covers Deerfield Beach to Ocean Reef out 20 NM.
Annotated example of SST stacked with Chlorophyll, with a candidate edge marked. Not for navigation.
Frequently Asked Questions
What is a temperature break?
A temperature break is a quick temperature change across a short distance at the boundary of 2 water masses. On an SST map it shows as a tight band of color change.
Why are there blank areas on my SST map?
Cloud blocks infrared, so an observed pass has holes where the satellite could not read the surface. A blended layer fills those holes by estimate.
Is a blended SST map less accurate?
It has full coverage but softer edges. It is less exact on thin edges and useful for the big picture. Use it on cloudy days, and use an observed pass to confirm edge position where the sky was clear.
Which side of the break should I fish?
It depends on the species and its range. Bait often pins to the edge, and the warm side is often the hunting lane. Confirm on the water with your own temperature gauge and what you see.
Does SST show temperature below the surface?
No. It reads the skin, about 10 to 20 micrometers deep. Microwave reads slightly deeper but still only the surface layer. Fish swim below what the map shows.
Can I navigate with an SST map?
No. SST and chart layers are not for navigation. Use official charts.
Before you run
Find the tight edge in your range, know what the image can’t see, and stack layers to rank your options. That gives you a better basis for deciding where to look, though it doesn’t promise fish.
Stack the break, Chlorophyll and current data in Breakpoint before you choose where to run.