



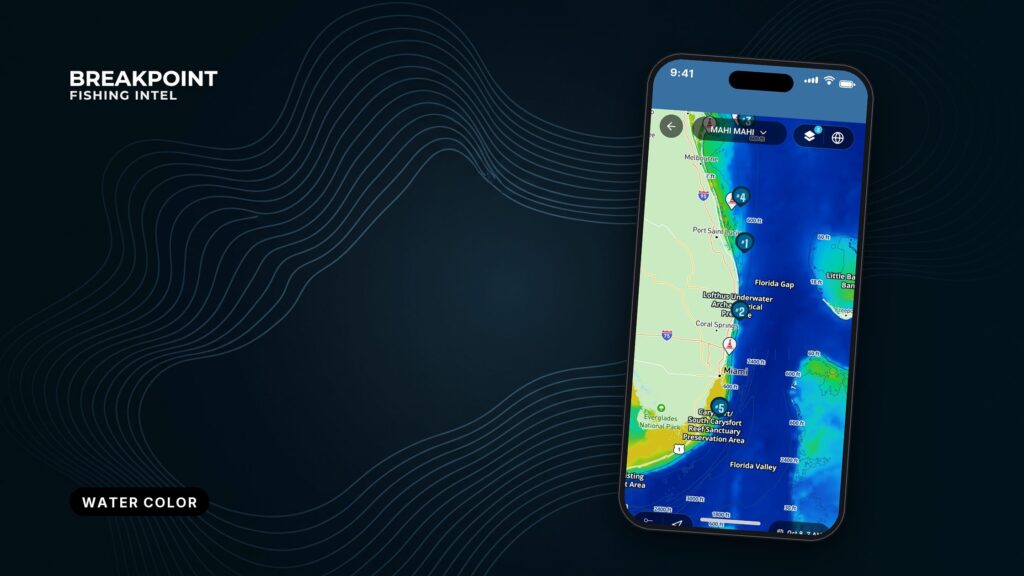
Not for navigation. Breakpoint charts are for trip planning. Navigate with official charts and your vessel’s instruments.
The productive edge for pelagic fishing is where blue water meets green, and the chlorophyll layer shows where that edge sits. This guide covers how to read it and how old the picture is. We build the layer, and we list our sources so you can judge it yourself.
Chlorophyll shows where the bait lives. SST shows where predators hunt. Put the two together and you get a short list of places worth the fuel.
By the end of this guide you will be able to read what the colors measure, explain why the edge holds bait, tell a real edge from a cloud gap, plan a run the night before, and confirm it on the water.
Chlorophyll concentration measures phytoplankton, not fish
The Chlorophyll layer shows chlorophyll-a concentration in the surface water, which stands in for how much phytoplankton is there. In practice:
- Chlorophyll-a is the pigment phytoplankton use to photosynthesize.
- Satellites read ocean color, meaning the light leaving the water, and an algorithm converts that reading to a concentration.
- The unit is mg/m³, milligrams of chlorophyll per cubic meter of water.
- The reading covers the surface layer only, not what sits deeper in the water column.
- It is a proxy for productivity, not a fish count.
The color ramp is logarithmic, so each step up the legend multiplies the value instead of adding to it. A small color change at the low, blue end can be a very small absolute difference. Judge an edge by how sharp the color change is rather than by how dramatic the colors look, and read the Chlorophyll legend in the app before you read the map.
Blue water is clear, green water is productive
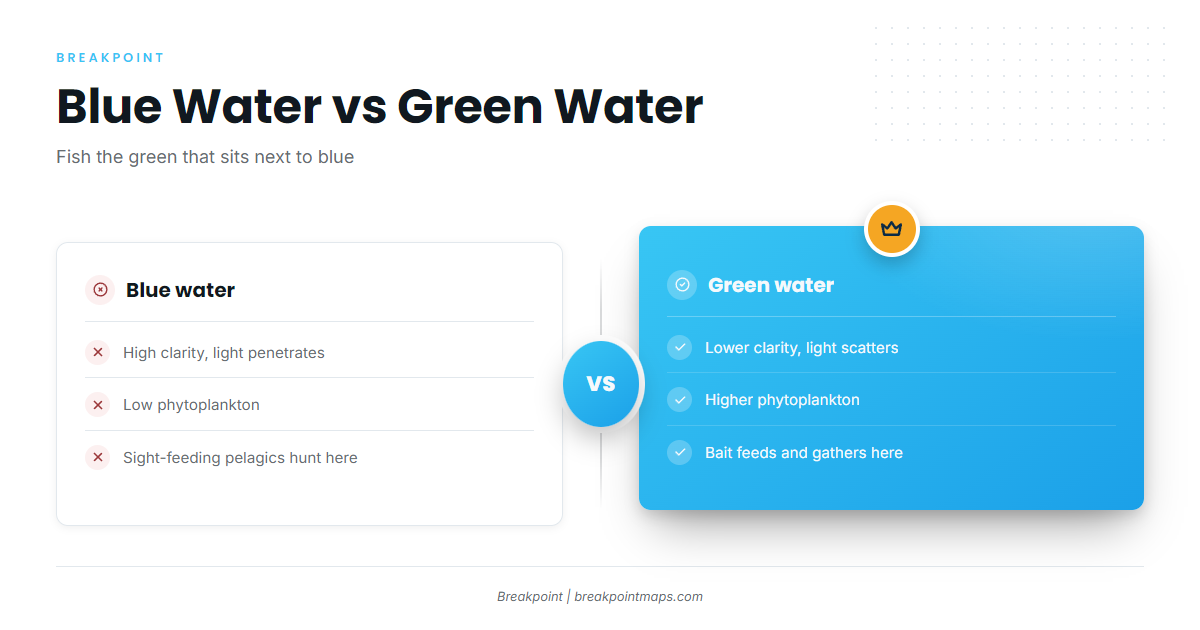
Blue water is clear and low in phytoplankton. Green water holds more phytoplankton and has less visibility. The fish you want usually work between them.
Clear water lets light penetrate and reads blue. Phytoplankton absorb blue light and shift the color toward green. Pelagic predators hunt largely by sight, so cleaner water gives them room to work.
A common mistake is reading "high chlorophyll" as "fish." The middle of the green is often too murky for mahi and tuna. Look for green that sits next to blue, with deeper blue water on the other side of the seam.
| Blue water | Green water | |
|---|---|---|
| Clarity | High; light penetrates far | Lower; phytoplankton and particles scatter light |
| Productivity | Low phytoplankton | Higher phytoplankton; supports the base of the food chain |
| Typical fish behavior | Sight-feeding pelagics hunt and travel | Bait feeds and gathers; predators work the clean edge of it |
The edge concentrates bait and pelagics
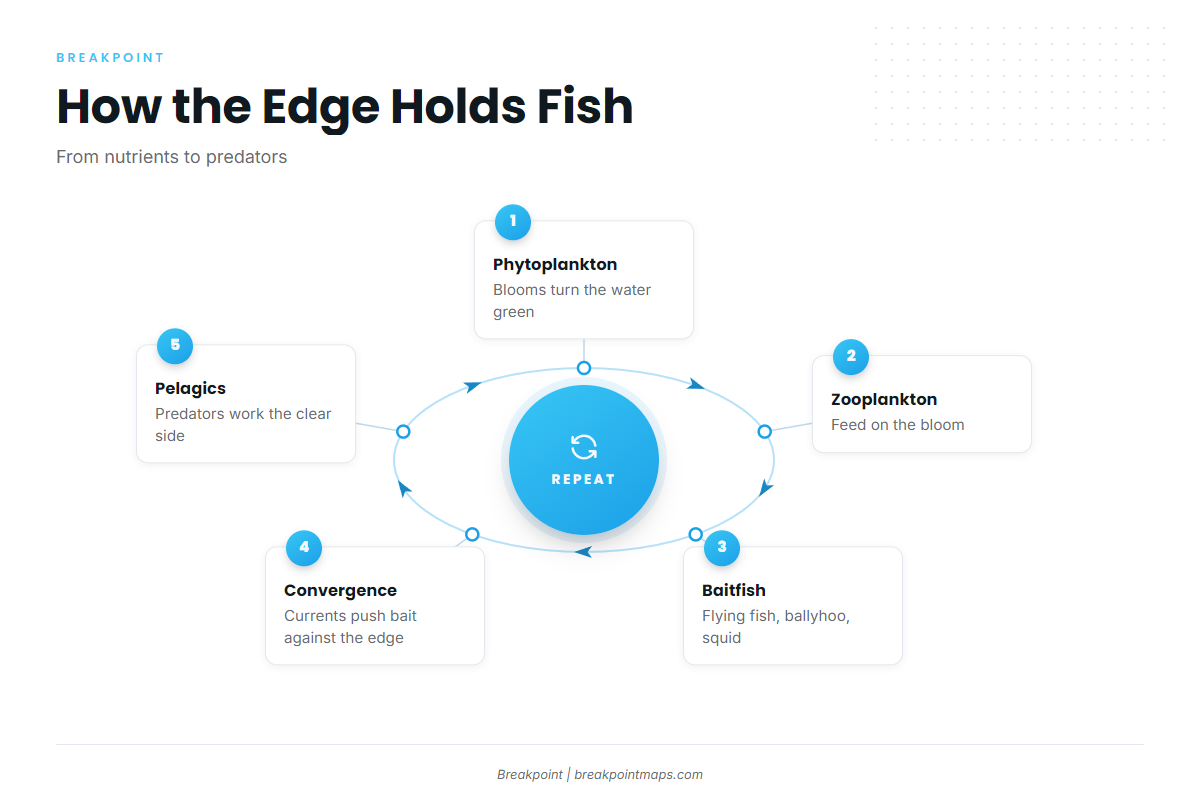
Color breaks hold fish because bait feeds in the productive green water and gets pushed against the clear blue edge, where predators can see it. A USPTO patent filing notes that bait gathers in greener water, billfish prefer bluer water, and temperature breaks often appear with color breaks and weed lines.
The food chain runs uphill to the edge
The chain runs in a short sequence:
- Phytoplankton bloom in the surface water.
- Zooplankton feed on the bloom.
- Baitfish such as flying fish, ballyhoo and squid feed on zooplankton.
- Pelagic predators feed on the baitfish.
Upwelling brings nutrients to the surface and feeds blooms that turn the water green. Eddies and current boundaries shape where those blooms sit. Altimetry, which measures sea surface height, shows eddy position, and the Chlorophyll layer shows what the eddy holds.
Convergence piles things up
Where 2 water masses meet, surface water converges and collects weed, debris and bait along a line called a rip. Moving current boundaries such as the Gulf Stream edge and the Loop Current create these lines.
Color breaks and temperature breaks often line up
The 2 water masses differ in both temperature and productivity, so a color break often sits on or near an SST break. Where the Chlorophyll edge and the OBS SST edge overlap, you have 2 reasons to look in the same place. When they don’t line up, treat each edge as a separate lead. Edges also move with current and wind, which is why the limits section below matters.
Where the Chlorophyll layer comes from
The Chlorophyll layer is built from ocean-color satellite sensors, distributed through public data portals, and shown as single-pass images, composites, or forecasts. We pull from those public sources and show the result with its timestamp.
| Sensor | Platform | Operator |
|---|---|---|
| VIIRS | NOAA-20, NOAA-21 | NOAA (with NASA) |
| OLCI | Sentinel-3 | EUMETSAT / Copernicus (ESA, EU) |
| OCI | PACE | NASA |
The public portals behind these sensors include NASA Ocean Color (OB.DAAC), NOAA CoastWatch and Copernicus Marine.
Single-pass versus composite
A single pass is one satellite overpass. It is the freshest view, but anything under cloud is blank. A composite merges several passes over several days. It fills gaps but blends older water into the picture, so edges can smear or sit where they used to be. Use the single pass to place the edge and the composite to see the pattern.
Cloud gaps versus real edges
A cloud gap shows as blank or masked pixels with blocky or ragged outlines. A real edge is a gradient between valid values that follows current or SST structure, and it usually traces a line on OBS SST. The outline of a gap matches nothing.
Chlorophyll forecasts
A forecast models where the water and its chlorophyll are likely to move after the last clear pass. Use it to plan, then confirm on the water.
What the data cannot see
Satellite chlorophyll cannot see through cloud, ages after every pass, can read falsely high near river mouths, and does not move when the water moves.
- Cloud. Optical sensors cannot see the surface through cloud. No data is not the same as no edge, so treat blank areas as unknown.
- Image age. Check the timestamp before you trust where an edge sits. Older imagery shows the pattern, not the position.
- CDOM and sediment. Near river mouths and inlets, dissolved organic matter and suspended sediment change water color and can read as high chlorophyll. Green near a river plume, such as inshore of Carolina Beach near the Cape Fear River, may be dirty water rather than bait water.
- Log-scale exaggeration. At the low end, small differences show as clear color steps. Do not chase a faint shift in blue that has no SST support.
- Edges move after the pass. Current carries the edge, and wind pushes surface water and weed. The Gulf Stream and the Loop Current shift their edges between passes. Expect the line to have moved, and plan to search along it.
None of this makes the layer less useful. It tells you how much to trust each picture.
Mahi on weed lines and color edges
Mahi key on floating sargassum, and sargassum collects along the same convergence lines that form color and temperature edges. The weed is free-floating and gives small fish shade and cover, and convergence lines gather it into lines and patches. For rigging and trolling along the weed, see our mahi guide.
Use the Chlorophyll edge and the OBS SST break to choose a stretch of line. The map cannot show the weed itself, so you find that by eye. Wahoo work the same edges.
Two grounds show the pattern:
- Carolina Beach boats run to the Gulf Stream for mahi in summer and autumn. The NWS Wilmington marine forecasts cover that run.
- Islamorada boats cross Hawk Channel to the reef and on to the Gulf Stream for mahi in spring, summer and autumn.
Mahi bag and size rules differ by jurisdiction. Check FWC for Florida state waters and NOAA Fisheries for federal waters before fishing.
Tuna on color breaks and current edges
Tuna usually hunt the blue side of a color break and ambush bait pushed against it, with current edges and eddies setting where that break sits.
- Yellowfin tuna and blackfin tuna work the clean side of breaks where bait stacks up. Blackfin are part of the Islamorada winter and spring fishery and the Carolina Beach fishery.
- Bluefin tuna will hunt into greener water more readily than other tunas.
- Eddies trap and spin productive water and carry edges with them. Altimetry shows the eddy, and Chlorophyll shows what it holds.
- Martha’s Vineyard carries summer bluefin, yellowfin and mahi.
Pick the break with blue water close on one side and bait-holding green on the other.
Reading the map the night before
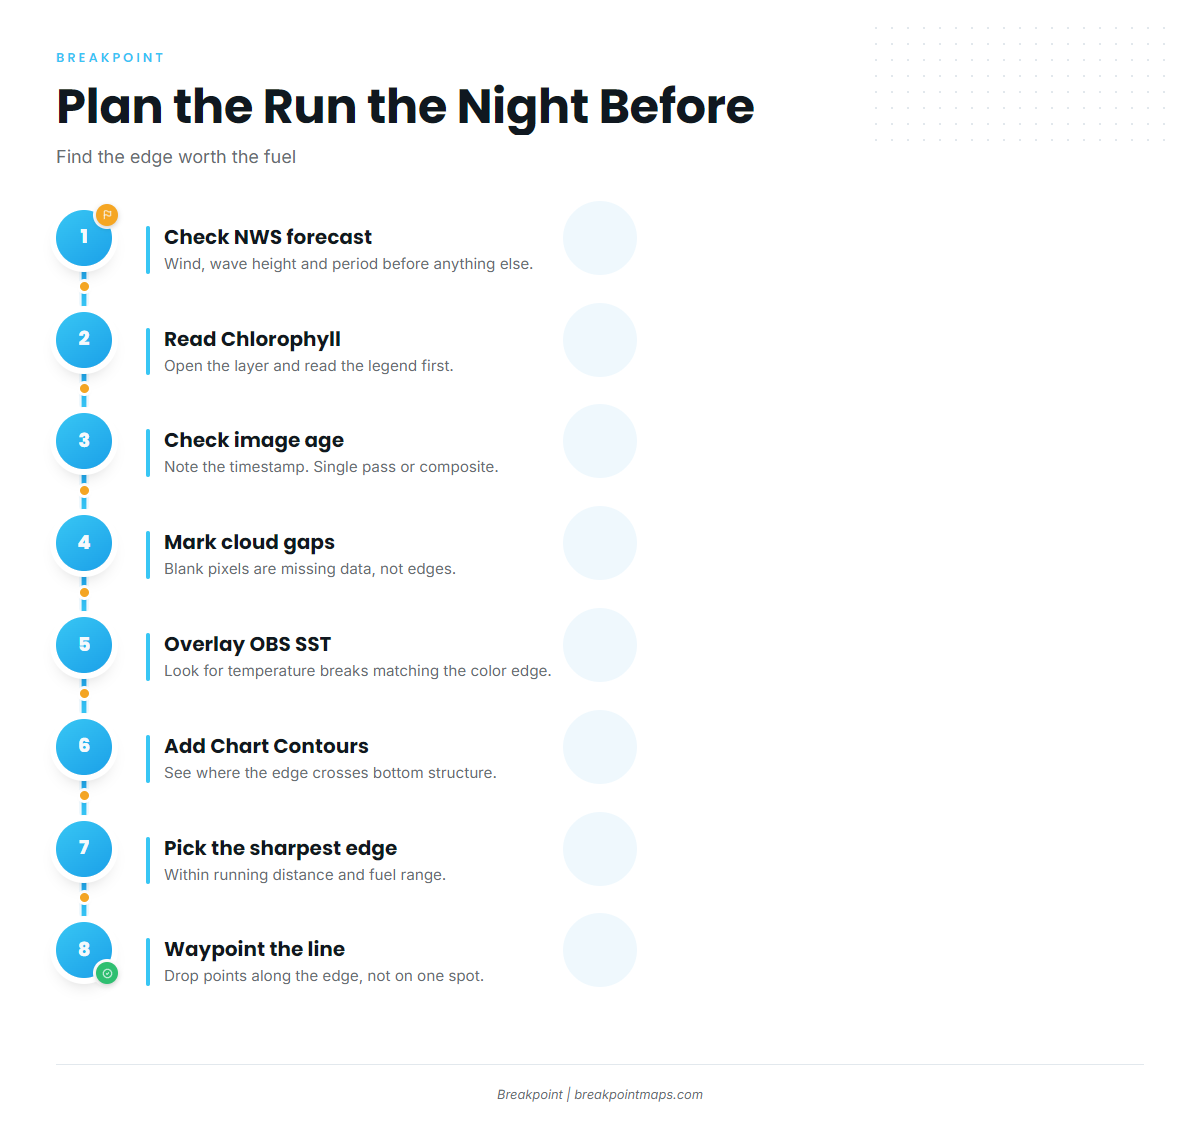
Plan the run the night before by finding where the Chlorophyll and OBS SST edges overlap within your range, then checking image age and the marine forecast.
- Check the marine forecast. Read wind, wave height and period from the official source. For the Islamorada run, use the NWS Key West coastal forecast. Take the numbers, not a verdict.
- Open Chlorophyll and read the legend.
- Check the timestamp. Note whether it is a single pass or a composite.
- Mark cloud gaps so you don’t read them as edges.
- Turn on OBS SST and look for breaks that line up with the color edge.
- Turn on Chart Contours to see where the edge crosses bottom structure.
- Pick the sharpest overlapping edge within practical running distance and fuel range.
- Offset your plan in the direction current and wind are likely to carry the edge.
- Drop waypoints along the line, not on a single point.
For an Islamorada run, start at the channel out of the harbor and cross Hawk Channel. Pass the reef line, which NOAA Coast Pilot 4 puts at an average of about 5 miles from the keys. Then look for the Gulf Stream edge on Chlorophyll and OBS SST. Turn on both layers together in Breakpoint and look for where the two edges overlap.
Chart layers are not for navigation. Use official NOAA charts.
Confirming it on the water
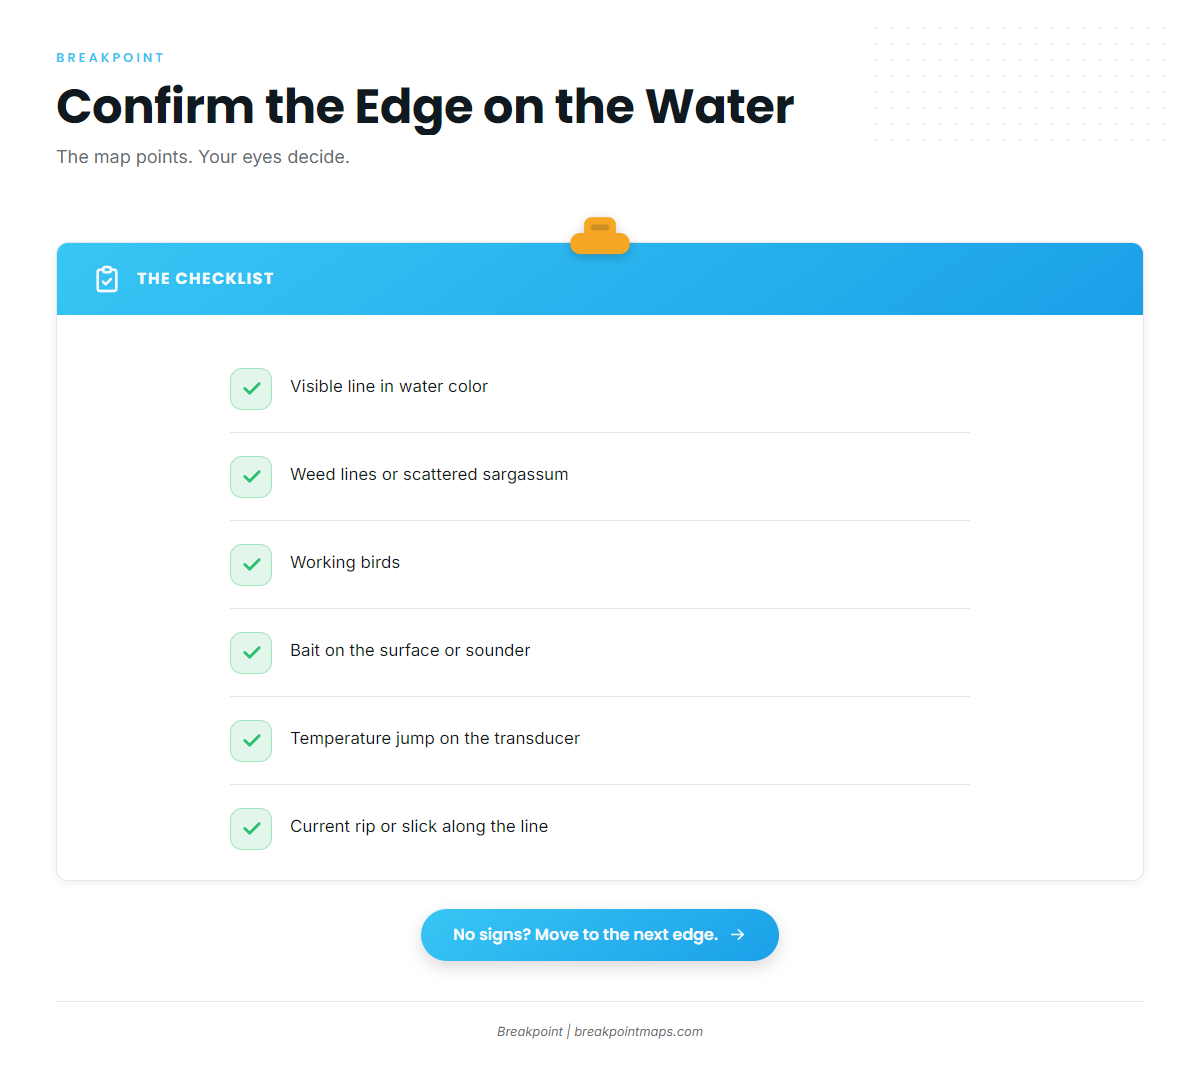
Confirm a mapped edge by seeing it: a visible color change, weed, birds, bait, and a temperature jump on the transducer. Check for these signs:
- A visible line in water color
- Weed lines or scattered sargassum
- Working birds
- Bait on the surface or on the sounder (flying fish, ballyhoo, squid)
- A temperature jump on the transducer readout
- A current rip or slick along the line
You can also cross-check water temperature against a nearby buoy, such as the NDBC Masonboro Inlet buoy off Carolina Beach, and compare it with OBS SST. If you find no signs after a fair search along the line, move to the next edge.
Frequently Asked Questions
What do the colors on a chlorophyll map mean?
Colors show chlorophyll-a concentration in mg/m³ on a log scale, from low and clear to high and productive. Scales differ between apps, so read the Chlorophyll legend in the app before you read the map.
Is blue or green water better for tuna?
Tuna usually hunt the blue side of a break next to green, bait-holding water. Bluefin tolerate greener water more readily than other tunas. Fish the edge rather than the middle of the green.
How do I tell a real break from a cloud gap?
A cloud gap is missing data with an outline that matches nothing else on the map. A real edge is a gradient between valid values that usually lines up with an edge on OBS SST.
How old is too old for chlorophyll imagery?
There is no fixed cutoff. Older images show the pattern rather than the position, because current and wind move edges after the pass. Check the timestamp, and treat composites and forecasts as planning tools.
Do chlorophyll and SST edges line up?
They often do, because the 2 water masses differ in both temperature and productivity. Overlapping edges give you 2 reasons to look in the same place. When they don’t align, treat each edge as a separate lead.
Are fishing maps for navigation?
No. Chart layers are not for navigation. Use official NOAA charts. For conditions, check the NWS marine forecast for wind, wave height and period.
Before the next run
Read the legend and the timestamp. Distrust river plumes and faint low-end shifts. Confirm by eye, and keep working along the line until you find fish or the signs run out.
Open the Chlorophyll layer before your next run and find the edge worth the fuel. You can download Breakpoint from the App Store or Google Play.
Chart layers are not for navigation. Use official NOAA charts. Check the NWS marine forecast for wind, wave height and period before you leave the dock.